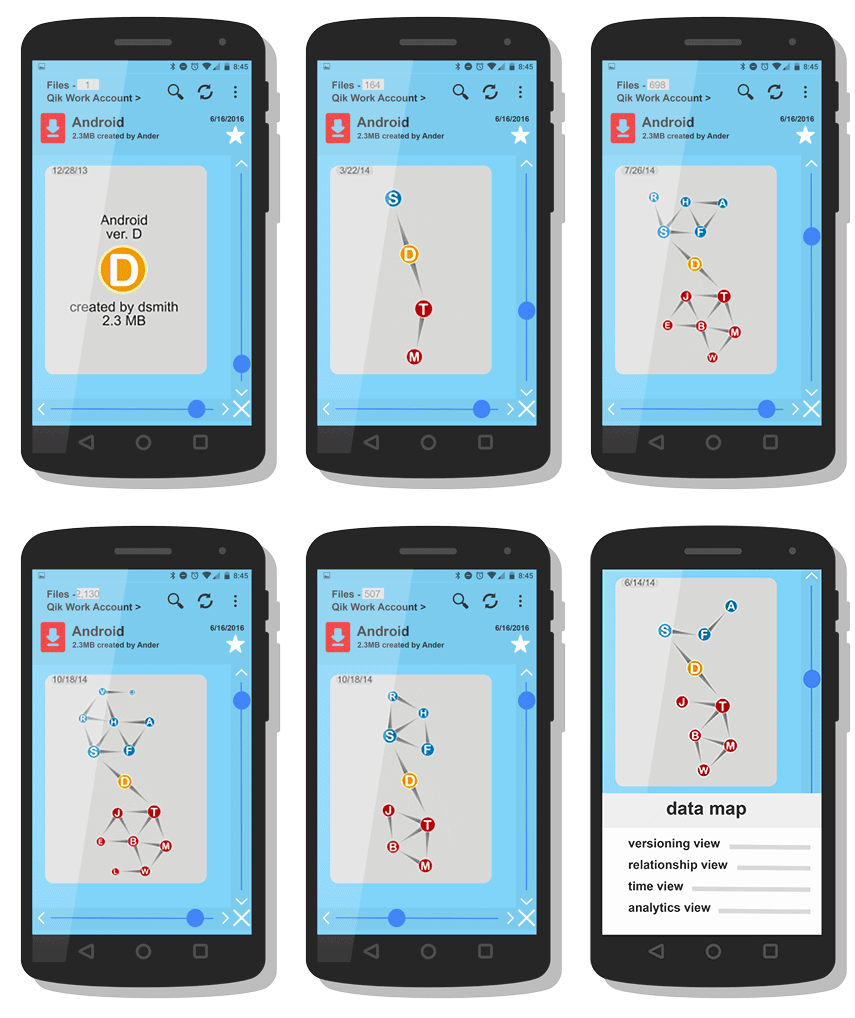
Visual representations for all project changes, file data changes and process changes, for complete project revisions visibility. Identify pattern trends that are difficult to detect in purely data driven analyses to improve existing efficiency and productivity. View who modified what, how, when, with what, and where. Visualization tools in 2D, 3D, or xD (VR, XR and AR) enable any user to understand very complex analyses of interactions, statuses, variations, and progress. Contextualization in Qikspace which allows dynamic visualizations also enables Transformers & LLMs to empower advanced AI & ML solutions.
Do what you do. See how 'do' got done

